Author: cameron
1. STICKERPAINT
Produce a tool small enough to fit in a bag, that can roll and stick a long line of stickers together in one go. Suitable for long messages, or communicating time and/or motion.
Good for escalators, busses, pillars (360 degree viewing)
2. STIXEL
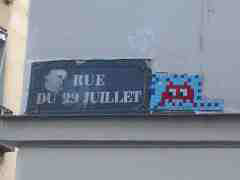
Use small square stickers, and arrange to produce pixel art. Color some in, do two layers to get 3d feel. Idea is to mess with the resolution of the wall. Placing overtop of existing advertising with sharp imagery will produce contrast. Guns & Ammo Theme.
3. STREET LENTICULAR
Use lenticular lenses overtop of inkjet printed images to produce morphing effect as viewer walks by. Imagery: anti-smoking, placed near smoker hangouts. Alternate theme: Fuck The Police + Image of Sting & Band.
 IN PREPARING MY ANIMATION for the KPN Telecom Building in Rotterdam for GRL‘s opening extravaganza, I built this little Flash applet to keep track of what stuff looks like on a pixelboard. It inputs and outputs binary CSV… and not much else. Download the source and mess with it if it’ll help you.
*update* now at v2… you can click & drag to draw (holy shit)
 POST-MORTEM POSITIVITY IS ABOUT VISUALIZING the good that people wish to do after their death. Using the dataset of the text taken from all the obituaries published in the United States for a given year, the system will search out the names of organizations that the decased will be leaving donations for either directly or as requested by families in memorial of the deceased. The 3d visualization will map the most popular charities to the age of the deceased on the Z axis, with the age (in discreet ranges) of the deceased on the X, and the number of deceased of a given age range giving to a particular charity on the Y axis.
SCALE:
population of USA: 298,444,215
death rate: 8.26/1,000 = 0.8%/year
annual deaths: ~2.4 Million deaths/year
annual deaths to nearest power of 10: 1,000,000
estimate number of deaths with obituaries (power of 10): 1%
number of organizations listed in two days of obits on legacy.com: 8/20 = 40%
number of organizations to nearest power of 10: 10%
estimate number of charities donated to (power of 10): 100
1,000,000 * .01 * .10 / 100 = 10 donations/charity/year
based on this estimate, I figure there would be enough data to visualize for a given year. If my calculations are high, I would add the ability to visualize data from more than one year at a time.
Visually, the 3d bar graphs will be gray on a green background to evoke gravestones, but with more lively and optimistic accent colours, like yellow (angelic) and baby blue (to symbolize new life).

EVERY WEEK THE EMPIRE STATE BUILDING is lit in different colors. This lighting display offers an unusual seperation of space & time from the message delivered by the system.
Space: since the ESB is New York City’s tallest building, the lighting display atop it can be experienced from all over the city, as opposed to a more location-specific display, like the subway’s pixelboards that display the next station.
Time: The ESB lights are changed on average once per week, so the display lacks the immediacy of say, the clock atop the Virgin megastore, which is updated every millisecond, or weather forcasting building spires, like Toronto’s Canada Life Building (updated four times daily). This gives the ESB lights the appearance of permanence, until the viewer has repeated exposure, and notices the changes occur from one night to the next, or until the viewer learns the significance of a particular combination of colors (by reading the schedule in Time Out New York, or on the esb website).
*edit* The Canada Life Building has the weather beacon, not the Canada Trust Building, and it is updated 4 times daily, not immediately, from Environment Canada’s Station at Toronto’s Pearson Airport.
 |
| hungry? |
pros:
-available online… immediate (no page reload)
-easy to start
-its the future and stuff
-standardsy
cons:
-serial I/O for physical interface? ummmm…
-never done it before
pros:
-easily available online
-I’m mad good at Flash
-readymade components (text fields, etc)
-flexible visually
-extensible
cons:
-no OPENGL or hardware rendering
-hard coded 3D sucks
-slow (relatively)
-physical interface may require Serial Proxy
Processing (via switchboard library & SOAP)
pros:
-OPENGL
-built-in 3D
-fast
-built-in serial i/o.
cons:
-intuitive interaction requires lots and lots of code


